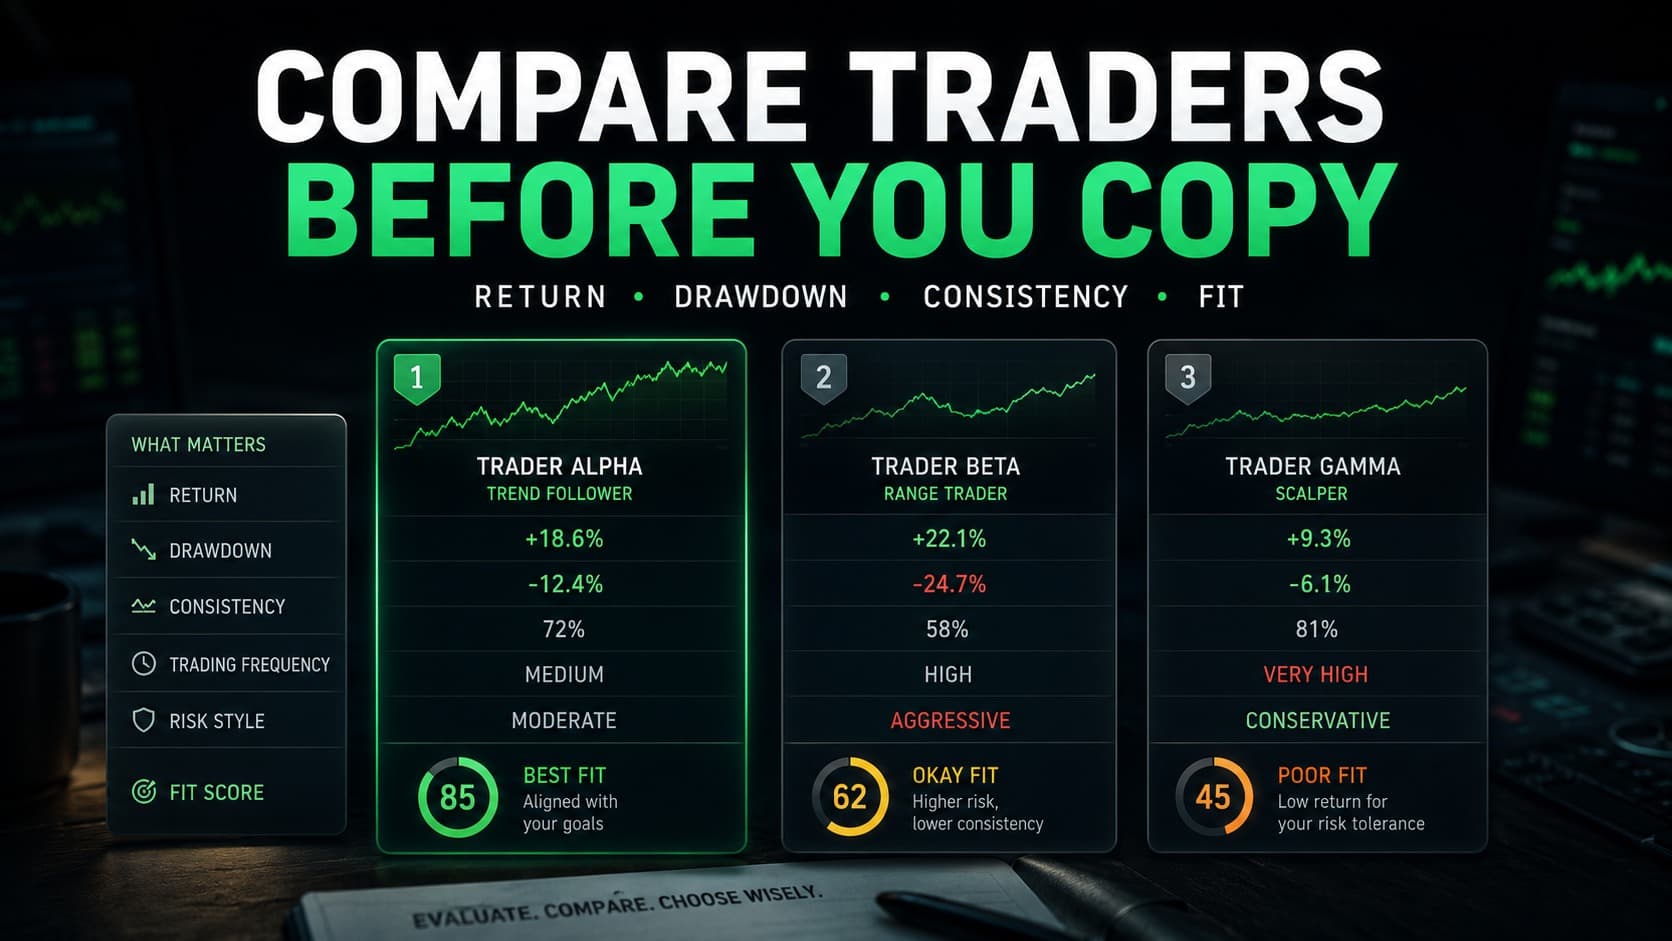
Copy trading often starts with a simple question:
Which trader should I copy?
For many users, the first place they look is the leaderboard.
They compare returns.
They look at rankings.
They check who performed best recently.
That seems logical.
But it is incomplete.
The trader with the highest return is not always the trader with the best fit.
A trader may show strong performance but also carry deep drawdowns, aggressive position sizing, unstable recovery behavior, or exposure to market conditions that may not match every user’s tolerance.
This is why trader comparison should not be based on returns alone.
Before copying a trader, users should compare behavior, risk, consistency, trading frequency, recovery, exposure, and fit.
Copy trading is not only about choosing a trader who performed well.
It is about choosing a trader whose behavior you can realistically tolerate.
Why Trader Comparison Should Go Beyond Returns
Returns are easy to compare.
One trader made more.
Another made less.
One appears higher on the leaderboard.
Another appears lower.
But returns only show outcome.
They do not explain the path behind that outcome.
A trader may generate high returns by taking large risks.
A trader may recover quickly by increasing position size.
A trader may look consistent during favorable market conditions but struggle when volatility changes.
Users do not experience return numbers in isolation.
They experience every trade, every drawdown, every recovery period, and every shift in risk exposure.
That is why trader comparison should go beyond top-line performance.
A trader comparison framework should evaluate behavior, not just performance.
This idea is closely related to How to Evaluate Copy Trading Performance Beyond Returns.
Direct Answer
How do you compare traders before copying them?
To compare traders before copying them, users should review more than top-line returns.
A structured trader comparison should include drawdown, consistency, trading frequency, asset focus, risk style, recovery behavior, position sizing, and whether the trader’s behavior fits the user’s risk tolerance and goals.
The goal is not to find the trader with the highest return.
The goal is to identify which trader’s risk path, behavior, and trading style are most suitable for the user.
The Problem With Leaderboard-Based Decisions
Leaderboards are useful.
They help users discover traders.
They make performance easier to scan.
They show who has recently performed well.
But leaderboards can also create emotional decisions.
Users may assume that the top-ranked trader is automatically the best choice.
That is not always true.
A leaderboard may highlight:
- Recent returns
- Short-term performance
- High growth
- Strong ranking movement
- Popular traders
But it may not immediately show:
- How much risk was taken
- How deep drawdowns became
- How consistent the trader was
- How often trades were opened
- How position sizes changed
- How the trader recovered from losses
- Whether the style fits the user’s tolerance
This matters because the best trader on a leaderboard is not always the best trader for you.
Trader selection should be structured, not emotional.
Return: What Performance Shows and What It Hides
Return is still important.
It shows whether a trader has generated positive results over a certain period.
But return should be treated as the starting point, not the final decision.
When comparing trader returns, users should ask:
- Was the return generated steadily?
- Was it produced through a few large wins?
- Did it require deep drawdowns?
- Was it achieved during one favorable market condition?
- Did the trader take aggressive risk to reach it?
- Is the return repeatable or highly irregular?
Two traders may have similar returns but completely different risk behavior.
One trader may produce returns gradually with controlled risk.
Another may produce similar returns through large position sizes and deeper drawdowns.
The final number may look similar.
The experience of copying them may feel very different.
Returns show outcome, but drawdown shows the path users may have to tolerate.
Drawdown: The Risk Behind the Return
Drawdown is one of the most important comparison factors in copy trading.
Drawdown shows how much a trader declined from a previous high before recovering.
A trader with high returns may still be difficult to copy if the drawdowns are too deep or too frequent.
When comparing traders, users should review:
- Maximum drawdown
- Average drawdown
- Drawdown frequency
- Recovery time
- Behavior during losing periods
- Whether risk increases during drawdown
- Whether losses are controlled or allowed to grow
Drawdown matters because it reveals the emotional and financial pressure behind performance.
A trader may look attractive when only returns are visible.
But if that return came with large declines, the user needs to decide whether they could realistically tolerate similar periods.
This is especially important because copied users experience drawdowns with their own capital.
A trader’s risk path becomes the user’s risk path.
Consistency: Is Performance Stable or Random?
Consistency helps users understand whether a trader’s performance appears stable over time or concentrated in a few unusual periods.
A trader may show strong results because of one exceptional month.
Another trader may show more moderate returns but steadier performance across multiple periods.
When comparing consistency, users should ask:
- Is performance stable over time?
- Are gains concentrated in short bursts?
- Are losses controlled?
- Does the trader recover in a structured way?
- Does performance depend on a few large trades?
- Does the trader behave similarly across different market conditions?
Consistency matters because copy trading is experienced over time.
Users do not only copy the final performance chart.
They copy the behavior that creates it.
A trader with moderate but stable behavior may be more suitable for some users than a trader with higher but unstable performance.
Consistency matters because copied users experience every trade, not only the final result.
Trading Frequency: How Often Does the Trader Take Risk?
Trading frequency affects how often a user is exposed to market risk.
Some traders open positions frequently.
Others trade selectively.
Neither approach is automatically better.
But they create different experiences.
A high-frequency trader may create:
- More trade exposure
- More spread and execution impact
- More frequent drawdowns
- More account activity
- More emotional pressure for the user
A lower-frequency trader may create:
- Fewer trades
- Longer waiting periods
- Less frequent exposure
- More dependence on selected setups
- Different patience requirements
Users should compare trading frequency because it affects how the strategy feels.
A trader who opens many positions may not fit a user who prefers lower activity.
A trader who trades rarely may not fit a user expecting frequent participation.
Trading frequency affects how often users are exposed to decision pressure and market risk.
Asset Focus: What Markets Does the Trader Depend On?
Asset focus matters because traders often perform differently across markets.
Some traders may focus on one asset, such as gold.
Others may trade multiple forex pairs, indices, crypto, or commodities.
A trader’s asset focus can reveal what type of market environment the strategy depends on.
When comparing traders, users should ask:
- What assets does the trader trade most often?
- Is performance concentrated in one market?
- Does the trader depend heavily on one symbol?
- Does the trader behave differently across assets?
- Is the user comfortable with that market exposure?
- Does the asset have high volatility or liquidity risk?
Asset focus matters because a trader may depend heavily on one market environment.
For example, a trader focused on XAUUSD may behave differently from a trader focused on major forex pairs.
That does not make one better than the other.
But it changes the risk profile and user experience.
Risk Style: Conservative, Aggressive, or Unstable?
Risk style describes how a trader behaves when taking and managing risk.
Some traders take smaller positions and aim for steadier results.
Others use larger position sizes, hold through deeper drawdowns, or trade more aggressively.
The problem is that risk style is not always visible from return alone.
Users should compare:
- Position sizing behavior
- Average trade size
- Loss tolerance
- Drawdown depth
- Frequency of large trades
- Behavior after losses
- Risk increases during volatility
- Exposure concentration
A trader may appear profitable but have a risk style that does not match the user.
This is why labels like “conservative” or “aggressive” are not enough.
Users need to understand behavior.
Risk style should be judged by how the trader actually trades, not by how the trader is marketed or ranked.
Recovery Behavior After Losses
How a trader behaves after losses can reveal a lot about structure.
Some traders recover gradually.
Others increase risk aggressively after drawdown.
Some pause or reduce exposure.
Others continue trading at the same pace.
Recovery behavior matters because losing periods are part of trading.
When comparing traders, users should ask:
- How does the trader respond after losses?
- Does risk increase after drawdown?
- Does the trader become more aggressive?
- Does the trader reduce exposure?
- How long does recovery usually take?
- Does recovery appear structured or forced?
- Has the trader recovered from multiple losing periods?
Recovery behavior reveals whether a trader responds to losses with structure or aggression.
This matters because a trader’s recovery style can significantly affect the user’s experience.
A trader who recovers through larger risk may look strong after the fact, but the path may be uncomfortable or unsuitable for some users.
Position Sizing and Exposure Behavior
Position sizing shows how risk is translated into real exposure.
A trader may have a good strategy but still create high risk if position sizing is unstable or aggressive.
Users should compare:
- Average position size
- Maximum position size
- Position size changes after wins or losses
- Exposure across multiple trades
- Whether trades overlap
- Whether risk is concentrated
- Whether position sizing is consistent
- Whether the trader increases size during stress
Position sizing matters because it determines how much of the trader’s behavior becomes real account exposure.
A trader with controlled position sizing may be easier to tolerate.
A trader with large or inconsistent sizing may create higher pressure, even if returns look attractive.
Position sizing is one of the clearest signs of whether a trader is structured or reactive.
Trader Fit: The Most Overlooked Comparison Factor
Fit is often the most overlooked part of trader comparison.
Many users ask:
Which trader is best?
A better question is:
Which trader fits me?
Fit is not about finding the best trader overall.
It is about finding the trader whose behavior matches the user’s tolerance.
A trader may be strong but still unsuitable for a particular user.
Trader fit includes:
- Risk tolerance
- Drawdown comfort
- Trade frequency preference
- Asset preference
- Capital size
- Patience level
- Volatility tolerance
- Expectations around recovery
- Comfort with open positions
- Ability to stay consistent during losses
For example, a user who becomes uncomfortable during drawdowns may not be suited for a trader with deep but historically recoverable declines.
A user who prefers fewer trades may not be suited for a high-frequency trader.
A user who wants broad exposure may not want a trader focused on one market.
This is why trader comparison should include fit.
The right question is not only:
Which trader performed best?
It is:
Which trader can I realistically stay aligned with?
How SmartT Fits Into Structured Trader Selection
SmartT can be understood as a structured environment where trader selection should be approached through comparison, risk awareness, and ongoing review rather than emotional reactions to leaderboard performance.
SmartT does not remove the need for user judgment or guarantee trader outcomes.
It can support a more structured approach to trader comparison by helping users think beyond top-line returns and focus on behavior, risk, consistency, and fit.
This matters because copy trading decisions are often emotional.
Users may feel drawn to the trader with the highest return, the strongest recent performance, or the most impressive ranking.
But structured participation requires more than reacting to numbers.
It requires asking better questions:
- How much risk was taken?
- How deep was drawdown?
- How consistent was performance?
- How often does the trader trade?
- What assets does the trader depend on?
- Does this trader fit my tolerance?
SmartT becomes more useful when trader selection is approached structurally rather than emotionally.
This connects to the broader idea of structure-first investing, where decisions are based on system behavior and fit rather than short-term performance alone.
Trader Comparison Checklist
Before copying a trader, users can use a structured comparison checklist.
Ask:
- What is the trader’s return history?
- What was the maximum drawdown?
- How consistent is performance over time?
- How often does the trader open positions?
- What assets or markets does the trader focus on?
- Does the trader use aggressive position sizing?
- How does the trader behave after losses?
- How long does recovery usually take?
- Does the trader depend on one market condition?
- Would I tolerate this trader’s drawdown with my own capital?
- Does this trader fit my risk tolerance and goals?
- Would I still copy this trader during a losing period?
This checklist is not about finding a perfect trader.
It is about avoiding shallow comparisons.
A trader should not be selected only because they rank high or show strong returns.
They should be compared through risk, behavior, consistency, and fit.
For users who want a broader pre-copying review, Questions to Ask Before Copying a Trader can help structure the decision before committing capital.
Frequently Asked Questions
How do you compare traders before copying them?
Compare traders by reviewing returns, drawdown, consistency, trading frequency, asset focus, risk style, recovery behavior, position sizing, and fit with your risk tolerance.
Is the trader with the highest return always the best choice?
No. The highest-return trader may also have higher drawdown, aggressive risk behavior, unstable performance, or a style that does not fit every user.
Why does drawdown matter when comparing traders?
Drawdown shows how much decline users may need to tolerate while copying a trader. It helps reveal the risk path behind the return number.
How important is consistency in copy trading?
Consistency is important because users experience the trader’s behavior over time, including winning periods, losing periods, trade frequency, and recovery after losses.
Should trading frequency affect trader selection?
Yes. Trading frequency affects how often users are exposed to trades, market risk, spread costs, drawdowns, and emotional pressure.
What does trader fit mean in copy trading?
Trader fit means whether a trader’s risk style, drawdown behavior, trade frequency, asset focus, and recovery pattern match the user’s risk tolerance and goals.
Does SmartT guarantee trader performance?
No. SmartT does not guarantee trader performance or remove risk. It can support a more structured approach to trader comparison, risk awareness, and ongoing review.
Closing Insight
The best trader is not always the trader with the highest return.
The best fit is the trader whose behavior, risk style, consistency, drawdown, trading frequency, and recovery pattern match what the user can realistically tolerate.
Copy trading is not only about copying performance.
It is about participating in a trader’s risk path.
That is why trader comparison should be structured.
Return matters.
Drawdown matters.
Consistency matters.
Recovery matters.
Position sizing matters.
Fit matters.
Comparing traders through structure helps users avoid emotional leaderboard decisions and focus on risk, behavior, consistency, and fit.
 Written by